|
|
||||||||||||||||||||||||||||||||||||||||||||||||||||||||||||||||||||||||||||||||||||||||||||||||||||||||||||||||||||||||||||||||||||||||||||||||||||||||||||||||||||||||||||||||||||||||||||||
|
|
|
|
|
 |
|
 |
||||||||||||||||||||||||||||||||||||||||||||||||||||||||||||||||||||||||||||||||||||||||||||||||||||||||||||||||||||||||||||||||||||||||||||||||||||||||||||||||||||||||||||||||||||||||
|
2021 Census |
||||||||||||||||||||||||||||||||||||||||||||||||||||||||||||||||||||||||||||||||||||||||||||||||||||||||||||||||||||||||||||||||||||||||||||||||||||||||||||||||||||||||||||||||||||||||||||||
|
|
The first results of the 2021 Census were
published in June and December 2022 and show information at Local Authority level, so
we are able to identify major data that relates to the Borough of
Colchester. At a later stage, we will be able to analyse this, and more
specific, data data by Parish. But here are the headlines: Population
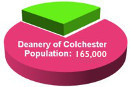
The area encompassing the Borough of Colchester is far greater than the area covered by the Deanery, which covers around 56 square miles; the Borough covers 125 square miles. Therefore, care should be taken when using the these figures. However, making an assumption based on the last census, we would estimate the Deanery's population at 165,000 in 2023.
Comparisons The overall population increase in England was 6.6% over the last decade. The East of England as a whole shows the highest percentage growth at 8.3%; Colchester's growth at 11.3% was the highest of the Local Authority areas which border us.
Of the 309 Local Authorities in England, Colchester is now in the 100 most highly populated (99th, up from 105 in 2021).
Here are the rankings for our local areas:
Density, dwellings and occupation At the time of the census, population density was 587 people per Km2, the equivalent of four people living on each football-pitch piece of land. The average for Essex is 435; Chelmsford is, for instance, 536 and Tendring 440. Colchester is of course relatively rural; the most dense areas are the London Boroughs, at around 15,000 people per Km2; in rural Wales, density can be as low as 25 people per Km2 There are 79,710 dwellings within the Borough - showing an increase of around 5,100 in the last decade. Here are the headline figures for occupation of houses in the Borough:
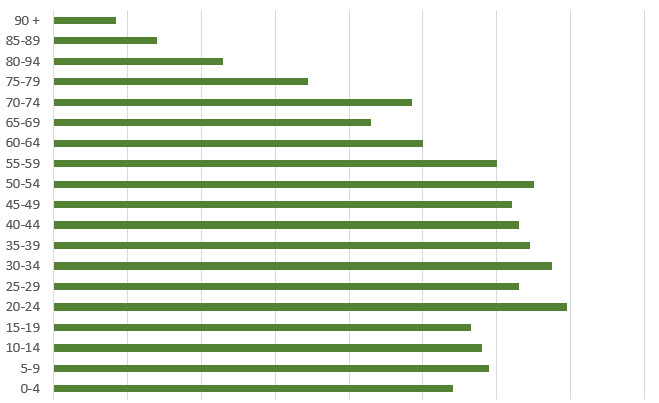
Deprivation Of the 79,710 dwellings in Colchester, 40,941 (51,4%) are not considered at all deprived; there is one category of deprivation in 26,500 (33.2%); two categories in 9,832 (12.3%); high deprivation in 2,292 (3%) and the worst deprivation in 145 (0.2%). More about our population Of the 192,700 people in the Borough in 2021, 98,500 (51.1%) were female and 94,200 male. Numbers in each age group are reported as follows:
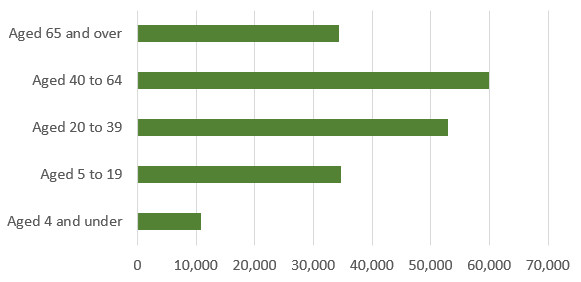
Or, in broader bands:
The number of children aged 0-4 has not changed significantly (up 1%) in the decade, whereas those of working age (say 20-64) at 112,900 shows an increase of 8.2%.The number of those 65 and over (34,300) is 25% greater than in 2021; however, it's a truism that anyone aged (say) 50 has personally aged 25% in the last decade! Country of birth The Census revealed the following:
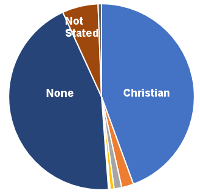
Religion Of the 192,716 residents of Colchester: 85,605 (44.4%) identify as Christian - down from 99,879 (58%) in 2011. 4,021 (2.1%) Muslim - up from 2,762 in 2011 2,546 (1.3%) Hindu - up from 1,274 1,321 (0,7%) Buddhist - up from 982 325 (0.2%) Jewish - up from 264.
85,484 (44.4%) indicated they had no religious affiliation; 12,037 (6.2%) gave no answer, and the remaining 1,144 (0.6%) expressed various views, including 145 Spiritualist; 56 Atheist (down from 96); 39 Humanist and 285 Pagan.
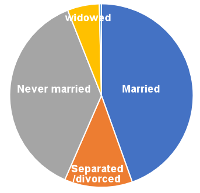
Marriage and Partnerships
Of the adults in Colchester:
Sexual Orientation Percentages have been published, but not numbers of people. However, based on the estimated population of 156,240 people aged 16 and over in the Borough, less 11,150 who did not answer the question, estimates are:
Gender Similarly, only percentages have been published for the Borough of Colchester at this time.However, based on the estimated population aged 16 and over in the Borough, less around 7,000 who did not answer the question, estimates are:
Source
All information on this page was summarised from the statistics published by the Office for National Statistics on their website.
These are early releases of the statistics from the Census, and more will follow in the months ahead, hopefully down to Ward level. Every effort has been made to ensure that the facts, figures and summarisations are accurately and appropriately represented, but we apologise if any errors have been inadvertently made. We trust that the information will be found helpful for Parishes in their ministry to the people of Colchester.
|
|||||||||||||||||||||||||||||||||||||||||||||||||||||||||||||||||||||||||||||||||||||||||||||||||||||||||||||||||||||||||||||||||||||||||||||||||||||||||||||||||||||||||||||||||||||||||||||
|
The Church of England Deanery of Colchester is part of the Colchester Episcopal Area of the Diocese of Chelmsford. The Chelmsford Diocesan Board of Finance is a registered Charity, no. 249505 We are committed to Safeguarding children and young people and vulnerable adults. As a Diocese, we have adopted the Church of England’s policies and best practice on safeguarding which may be found on the Church of England’s website: https://www.churchofengland.org/more/safeguarding. Diocesan guidance is available at https://www.chelmsford.anglican.org/safeguarding
|
||||||||||||||||||||||||||||||||||||||||||||||||||||||||||||||||||||||||||||||||||||||||||||||||||||||||||||||||||||||||||||||||||||||||||||||||||||||||||||||||||||||||||||||||||||||||||||||


 The population of the Borough of
Colchester has increased by 11.3% since the last census in 2011. The
population of the Borough at that time was 173,074; it was 192,700 at
the time of the latest census, and will have grown further in the last
year.
The population of the Borough of
Colchester has increased by 11.3% since the last census in 2011. The
population of the Borough at that time was 173,074; it was 192,700 at
the time of the latest census, and will have grown further in the last
year.